
Welcome to Trump’s disruption world tour.
If you think this is going to be quick?
If you think this is going to be easy?
Think again.
If you think Trump cares about Wall Street?
If you think Trump cares about the value of the U.S. Dollar?
Maybe not.
This is a total reboot of the world’s monetary and trade order. Things are going to break.
And at the risk of sounding like a broken golden record, there’s an obvious reason why gold is catching fire in today’s market. And it’s not anywhere close to over.
So what does history have to say? How high could gold run? Let’s dive in…
Gold in the 1970s
Gold began the 1970s trading near the official U.S. government rate of $35 per ounce.
In 1971, when Nixon ended the dollar’s convertibility into gold, bullion was suddenly freed from its shackles.
By January of 1980 gold was trading around $850/oz. A roughly 24x increase in price. Quite a run.
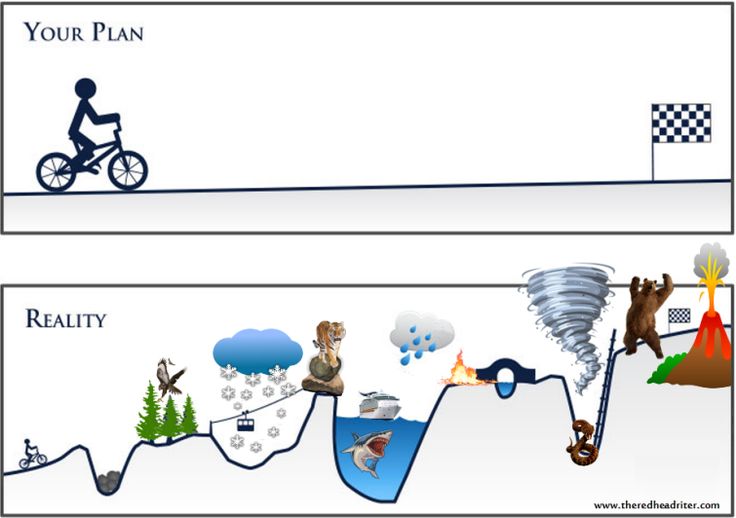
But gold didn’t get there in a straight line. It was a bumpy, jumpy, and jagged road.
By mid-1973, gold was trading around $90/oz.
And as the chart below shows, by 1975 bullion had reached an impressive $195/oz.
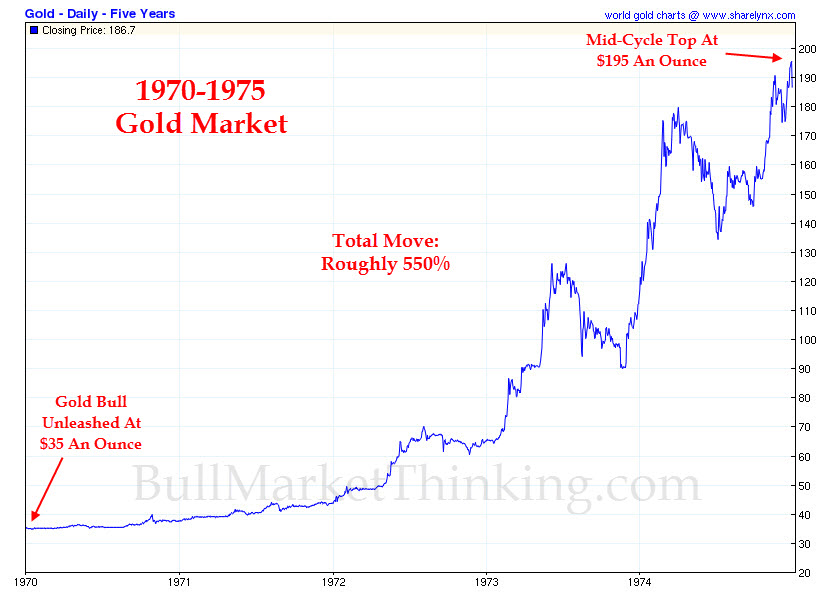
Source: Mining.com
On January 1st 1975, it finally became legal for Americans to own gold bullion. Since 1933 it had been a serious crime.
This had caused a runup in the price of gold as foreign investors bought in anticipation of US legalization. But it turned out to be a “sell the news” type of situation.
In 1975 the Federal Reserve raised interest rates and appeared to be getting serious about fighting inflation.
The price of gold fell from $195 in 1975 to $105 in 1976. A 46% collapse! Disaster, or so it seemed.
Newspapers ran headlines such as, “Gold: The Bubble That Burst”.
Many gold owners lost hope and sold their coins, bars, and mining stocks. These folks missed out on the run from $105 – $850.
Investors in 1975 thought the government had gotten control of inflation and spending, but it turned out to be a false signal.
By 1978 inflation in the U.S. was back above 10%, and gold was flying high.
Gold would peak at around $850/oz in 1980, after beginning 1970 trading at $35/oz. It was truly an epic run. But if history is any guide, what we’re about to see will be even more significant.
Investing in an Age of Disruption
The 1970s was a period of monetary and economic disruption. The price of gold soared nearly 24x during this time.
We are entering an even more disruptive period now. The debt and deficit situation is reaching a tipping point. At some point the Fed will simply have to print money to pay our country’s bills, and buy our debt. Eventually we’ll see something approaching hyperinflation.
As our friend Jim Rickards said in his best-selling book, The New Case for Gold:
“When confidence in central banks is lost, the flight is always to gold. It has no counterparty risk. It is not a promise; it is the asset.”
But just like the ‘70s, precious metals won’t go up in a straight line. There will be ebbs and flows, peaks and troughs.
The simplest method is to buy and hold gold and silver investments for the long run. When it comes to deciding when to sell some of these holdings, that’s the trickier part.
When the time comes to take some profits in gold and silver, there will be signs. The government will finally get its deficits under control. The debt will have shrunk, likely as a result of sustained inflation.
Stock markets will have crashed, and leading companies will trade at huge discounts. The public’s desire for stocks will have been discarded.
Then, and only then, will it be time to trade some precious metals for other assets such as deeply-discounted shares of great companies.
I don’t expect to sell my gold and silver investments for at least another 8 years, and probably longer. The mess we have to work our way out of is that serious. To be perfectly clear, it’s a long way off.
The magnitude of what we face today is much larger than the 1970s. In the ‘70s, America’s debt-to-GDP ranged from 31-35%. Today it’s at a shocking 123%, with even more “off-balance-sheet” liabilities such as Medicare and Social Security which are unfunded.
Make no mistake, the scale of what we face is massive.
If and when gold and silver face a major correction, don’t make the mistake of selling your holdings, like so many did in 1975. We’re not even close to a peak yet.
Have a great Memorial Day weekend everyone. Let’s take some time to reflect on the sacrifices made by those in our military.


